


With the Premier League comprising teams from all across the country, weather conditions vary from game to game. These are the stadiums with the worst weather on average.
‘Can they do it on a cold Tuesday night in Stoke?’ was once used as the yardstick to measure a player or team’s quality, given the testing conditions often presented in the Potters’ backyard. While Stoke City may now be plying their trade in the Championship, English football’s top-flight still provides some of the most testing conditions for the beautiful game.
The cold northern nights, the coastal winds, and the rain in the west each present their own challenges for Premier League sides – as well as influencing fans’ Premier League betting decisions – yet some teams seem to suffer more than others.
To determine which Premier League ground experiences the worst weather, we’ve ranked them based on their average temperature, rainfall, and wind speed to provide an overall index score and identify which stadium offers the most challenging climate.
Curious to see where your team’s stadium ranks? Read on for our breakdown of the weather at each Premier League ground.
The Coldest Stadiums in the Premier League
English football is regularly played in freezing conditions during the harsh winter months. Here are the top five Premier League stadiums with the coldest average temperatures:
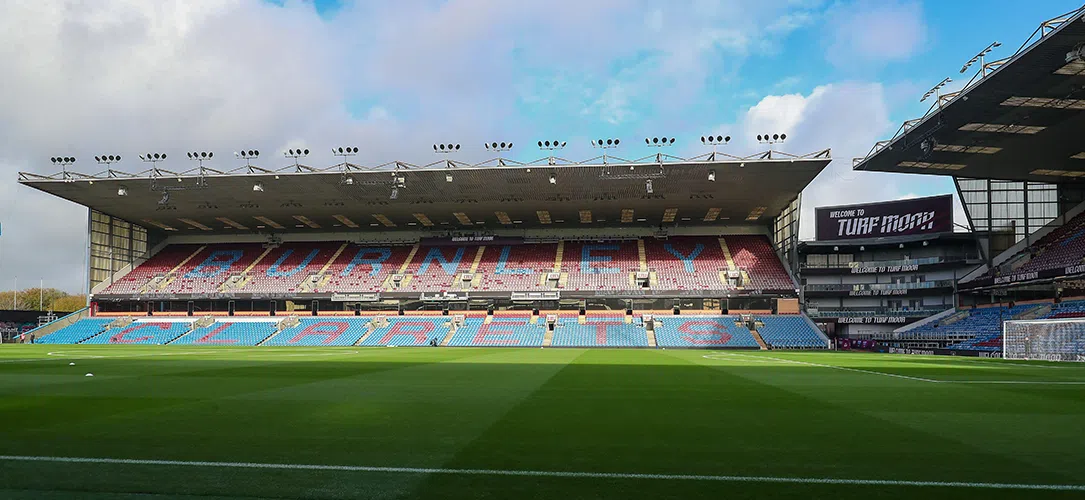
Turf Moor (Burnley)
Turf Moor has the coldest average temperature in the Premier League, with an average of just 8°C, and with Burnley currently facing relegation, their football is doing little to warm the supporters up.St James’ Park (Newcastle)
It will come as little surprise that St James’ Park has the second-coldest average temperature in English football’s top-flight at just 8.1°C.Molineux (Wolves)
It’s been a dismal 2025/26 campaign for Wolves, and with Molineux having an average temperature of 8.3°C, there isn’t much for fans to smile about, both on and off the pitch.Elland Road and The Stadium of Light (Leeds and Sunderland)
In joint-fourth are Elland Road and the Stadium of Light. At 8.4°C, the homes of both Leeds United and Sunderland are on the chilly side.Villa Park (Aston Villa)
Villa Park has an average temperature of 8.5°C, yet Unai Emery’s side has been amongst the most impressive in the Premier League in recent seasons.
The Rainiest Stadiums in the Premier League
Premier League pitches, with their underground heating and drainage, can cope with heavy rainfall in the modern era, but it doesn’t make playing or spectating in torrential conditions anymore enjoyable. Here are the top five stadiums with the highest average rainfall:
Turf Moor (Burnley)
Not only is Turf Moor the coldest Premier League stadium, but it is also the rainiest. Burnley’s home ground sees the most rainfall in the top-flight, with an average of 59.93mm of rain each month.Old Trafford (Manchester United)
Given Manchester’s reputation, it’s no shock that Old Trafford has been named the second-rainiest Premier League ground. The Theatre of Dreams faces plenty of, with an average of over 56.97mm per month.Hill Dickinson Stadium and Anfield (Everton, Liverpool)
Continuing the theme of stadiums in the northwest being the wettest, both the Hill Dickinson Stadium and Anfield average 55.41mm of rain a month.
The Etihad Stadium (Manchester City)
Like their city rivals, Manchester City are no strangers to experiencing a downpour. The Etihad Stadium experiences 54.55mm of rain every month, but at least Pep Guardiola’s side makes sitting in the rain worthwhile for their fans.
The Vitality Stadium (Bournemouth)
Bournemouth is another team that plays in an area with higher-than-average rainfall, with an average of 52.69mm per month. The Vitality Stadium is situated on the south coast, so significant rainfall is to be expected.
The Windiest Stadiums in the Premier League
While windy conditions can provide the odd comical moment, they also make it a challenge for players to play in. Here are the top five Premier League stadiums with the strongest winds:
The Vitality Stadium (Bournemouth)
Bournemouth experiences the strongest winds in the Premier League, with an average wind speed of 14.4 mph recorded at the Vitality Stadium.The Stadium of Light (Sunderland)
The Stadium of Light is another ground that contends with strong winds, averaging 14.1 mph. The unpredictable gusts did contribute to one of the most iconic goals in Premier League history, though, when Darren Bent’s strike deflated past Pepe Reina in the Liverpool net off an inflatable beachball that had been blown onto the pitch.The American Express Stadium (Brighton)
Like Bournemouth, Brighton & Hove Albion’s stadium is located on the south coast, and as a result, faces regular winds of 13.8 mph, adding an extra challenge to the playing conditions.St James’ Park (Newcastle United)
At the opposite end of the country to Bournemouth and Brighton, Newcastle is also known for its strong winds, with an average wind speed of 13.7 mph. This rarely fails to dampen the atmosphere at St James’ Park, with the Geordies regularly creating an electric atmosphere.Hill Dickinson Stadium and Anfield (Everton, Liverpool)
Both the Hill Dickinson Stadium and Anfield experience a consistent wind speed of 12.3 mph.
The Overall Worst Weather Index
When we combine the average temperature, rainfall, and wind speed, the following stadiums have the worst overall weather conditions:
Turf Moor (Burnley)
With an overall index score of just 25 out of 100, Turf Moor has been named the current Premier League stadium with the worst weather on average.
The Vitality Stadium (Bournemouth)
The Vitality Stadium is home to the second-worst weather conditions in the English top-flight. Bournemouth’s home ground came out with an index score of 35.16.
The Stadium of Light (Sunderland)
Sunderland’s long-awaited return to the Premier League has provided entertainment on the pitch, but the weather in the northeast hasn’t been quite as joyous. A score of 38.83/100 means the Stadium of Light is in third place.
St James’ Park (Newcastle)
St James’ Park received an index score of 38.85, meaning Newcastle receives slightly better weather than its local rivals, Sunderland.
Hill Dickinson Stadium and Anfield (Everton, Liverpool)
In joint-fifth position with an index score of 48.01 are the Hill Dickinson Stadium and Anfield. There is nothing to separate the weather at the homes of city rivals Everton and Liverpool.
Rank | City | Team | Avg Temp (°C) | Avg Rainfall (mm) | Avg Wind Speed (mph) | Index Score |
20 | Burnley | Burnley | 8 | 59.93 | 12 | 25.00 |
19 | Bournemouth | Bournemouth | 9.6 | 52.69 | 14.4 | 35.16 |
18 | Sunderland | Sunderland | 8.4 | 43.06 | 14.1 | 38.83 |
17 | Newcastle | Newcastle United | 8.1 | 43.05 | 13.7 | 38.85 |
15 | Liverpool | Everton | 9.3 | 55.41 | 12.3 | 48.01 |
15 | Liverpool | Liverpool | 9.3 | 55.41 | 12.3 | 48.01 |
14 | Brighton | Brighton & Hove Albion | 9.6 | 47.03 | 13.8 | 51.53 |
13 | Manchester | Manchester United | 9.4 | 56.97 | 11.8 | 51.82 |
12 | Manchester | Manchester City | 9.1 | 54.55 | 11.7 | 53.02 |
11 | Leeds | Leeds United | 8.4 | 45.67 | 11.8 | 58.13 |
10 | Wolverhampton | Wolverhampton Wanderers | 8.3 | 44.08 | 11.2 | 65.83 |
9 | London | Crystal Palace | 9.3 | 45.18 | 12.3 | 66.29 |
8 | Birmingham | Aston Villa | 8.5 | 43.33 | 11.3 | 68.91 |
7 | Nottingham | Nottingham Forest | 9 | 42.32 | 11.7 | 73.49 |
5 | London | Chelsea | 9.9 | 43.05 | 11.5 | 86.77 |
5 | London | Fulham | 9.9 | 43.05 | 11.5 | 86.77 |
4 | London | Brentford | 10.2 | 42.47 | 11.5 | 91.97 |
1 | London | Arsenal | 10.4 | 41.28 | 11.7 | 94.79 |
1 | London | Tottenham Hotspur | 10.4 | 41.28 | 11.7 | 94.79 |
1 | London | West Ham United | 10.4 | 41.28 | 11.7 | 94.79 |
Methodology
This dataset ranks all Premier League stadiums based on the average for each weather condition across 2025. The closest weather station was used for each stadium.
The factors used are as follows:
Avg Temp – The average temperature in each location
Avg Rainfall – The average monthly rainfall levels in each location
Avg Wind Speed – The average wind speed levels in each location
The factors were indexed as follows:
Avg Temp – Higher is better.
Avg Rainfall – Lower is better.
Avg Wind Speed – Lower is better
All data is correct as of February 2026.